Click to view full size:
"Exploring Graphite Paint Potentiometers"
A classroom activity by RET teacher Jesse Kasehagen of Santa Barbara Middle School providing exposure to basic electronics using low-cost material by utilizing "Manylabs.com" arduino sensors and "Bare Paint" conductive graphite paint. This lab leads students through experiments measuring the change in resistance of pieces of paper painted with a dilution series of watered-down conductive paint. Students also simultaneously measure the amount of light transmitted through these sheets and compare the two sets of data. The conductive properties of graphite are due to it being composed of many layers of graphene. More information and activities exploring graphene.
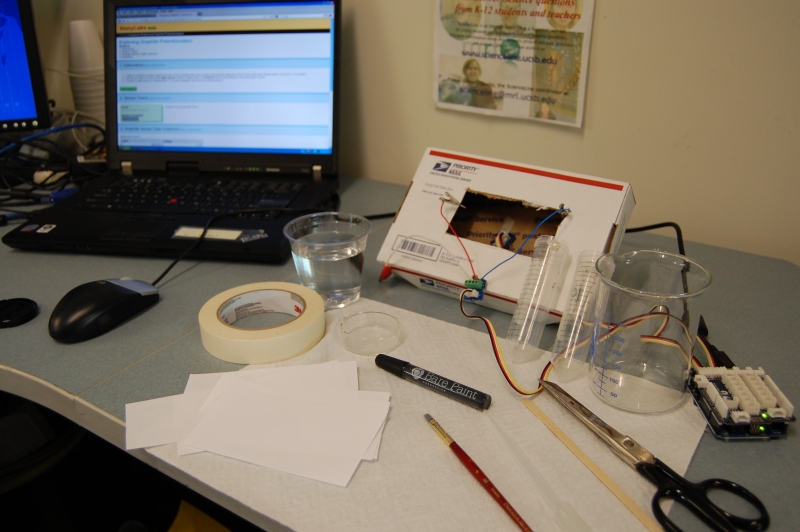
MATERIALS: (see slideshow below for pictures of these materials)
Bare Paint (the pens are even better than the jars as they seal better / keep longer).
ManyLabs individual or teacher account
ManyLabs large sensor kit with arduino (please note we will only use the arduino Uno R3 board, Grove shield, analog light sensor, screw terminal and connector wires. Other sensors can be used in future projects).
Toothless alligator clips and jumper wire: use some conductive paint to "cold solder" one end of jumper wire to the clips. Alternately buy these pre made wired clips, cut one end off and strip enough wire to fit into the screw terminal.
A small box, about half the size of a shoebox is fine.
A light source: small lamp or flashlight.
Paintbrushes, paper, tape and scissors.
INSTRUCTIONS:
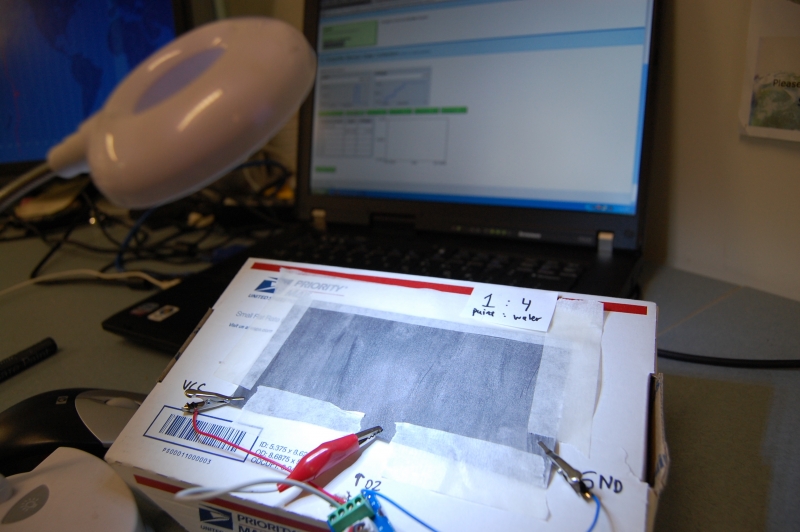
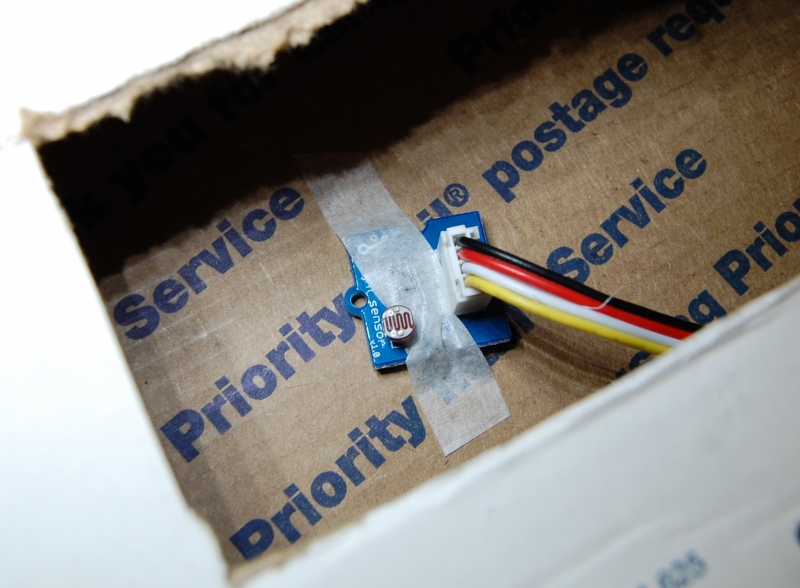
1. Cut a hole in the box which the light sensor will go into. The hole does not need to be large, approximately the size of an index card is fine. Use tape to affix the light sensor to the bottom of the box (make sure not to cover the sensor itself). Also cut out several pieces of paper large enough to cover the hole. You will soon paint these sheets of paper with watered down solutions of conductive paint.
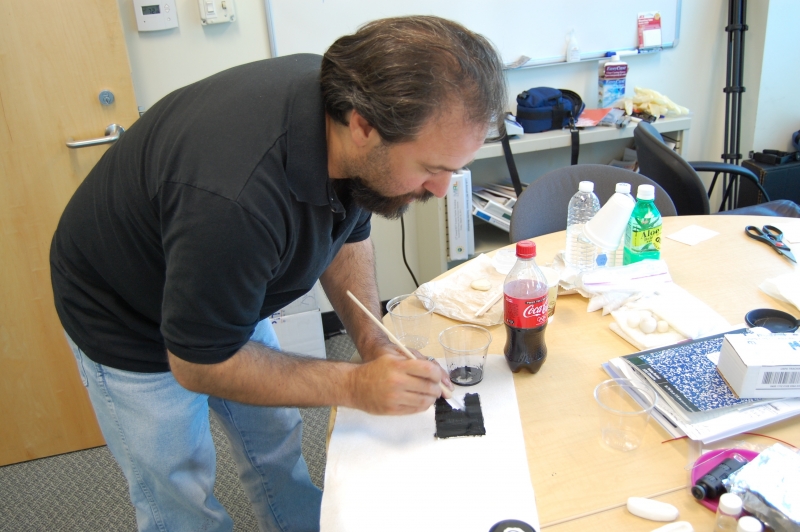
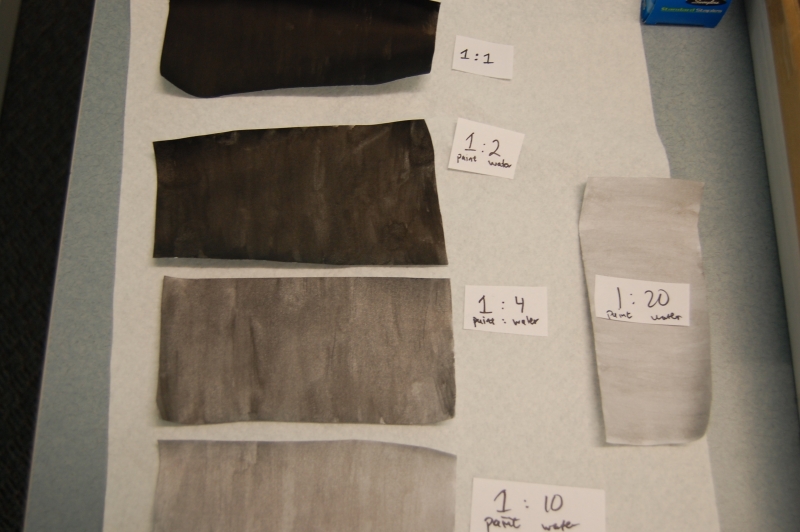
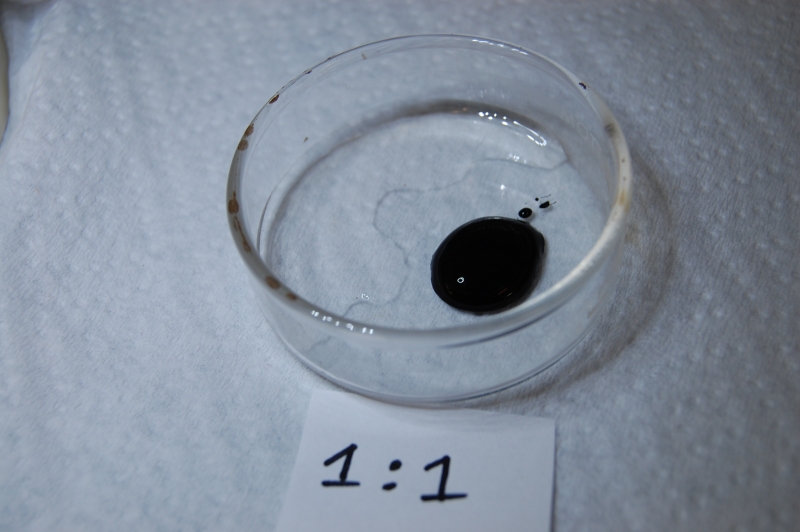
2. Mix two parts water with one part bare paint (by volume). Be as precise as possible but its also fine if this is an approximation. Starting with around 2 mL's of paint and 4mL's of water is more than enough. Using a brush, evenly coat a piece of paper with the 1:2 dilution. Make a small label saying "1:2" and place it next to this paper somewhere where it can dry.
3. We will now use this same solution to make a "serial dilution" of other mixtures of paint and water (we wont need to use any more of the paint besides the initial 2 mL's). To make a more dilute 1:4 solution, add 4 more mL's of water to the 1:2 dilution (this is assuming you started with 2 mL's of paint and 4 mL's of water for the initial 1:2 solution). Its very important for the application of the paint to be consistent on each of the papers you make at each point of this dilution series, so if you had a certain way you painted the paper for the 1:2 solution, do it the same way for the 1:4.
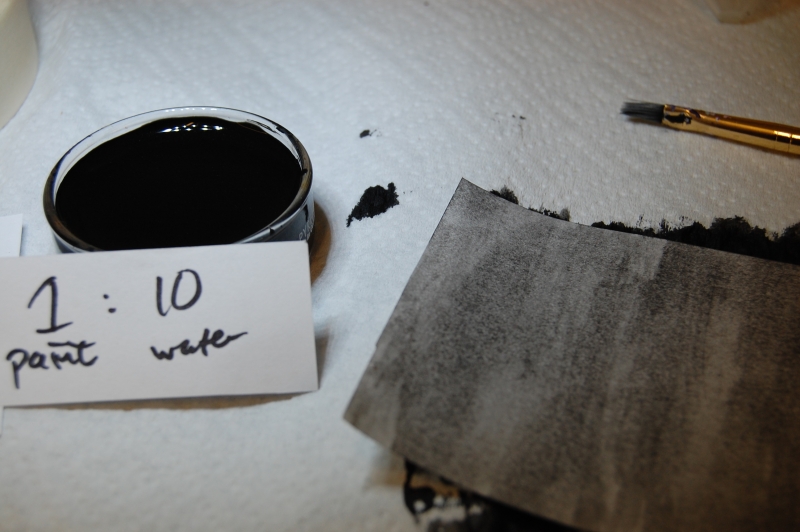
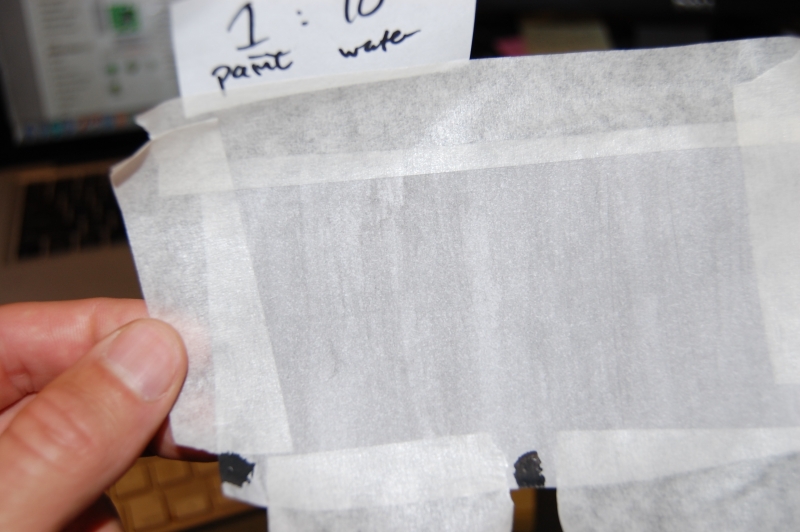
4. Make a 1:10 solution by adding enough water to make your solution contain 2mL's of paint and 20 mL's of water. Also prepare and paint a 1:20 and 1:25 solution on the sheets. You can also make other solutions of your choosing as well.
One tip which leads to more consistent results by improving the contact points between the alligator clip and the paint is to put a small section of conductive paint on the parts of the paper which will come into direct contact with the alligator clips. This will be on the bottom corners of the sheet and in the bottom middle of the sheet (see pictures below for an example of this).
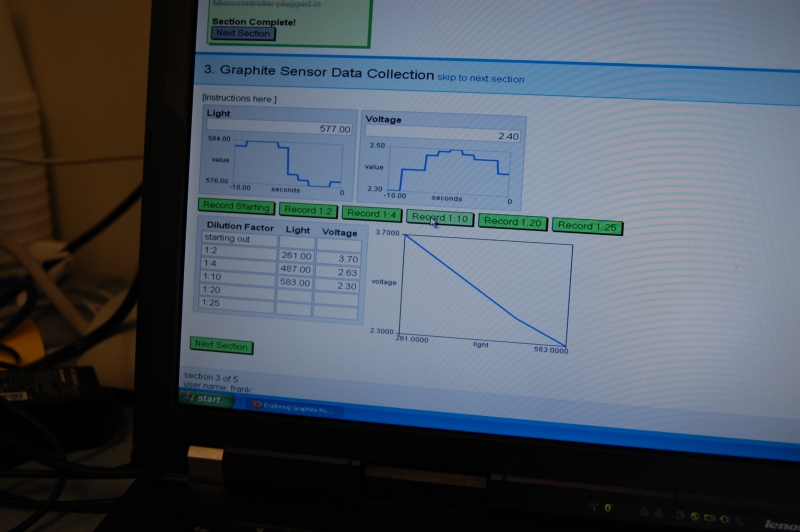
5. After all of these sheets have dried (be sure to keep good track of which dilution is which) proceed to step 3 of the online ManyLabs activity: Graphite Sensor Data Collection. Tape each sheet over the opening of the box leaving the spots of the sheet open for the clips (these are the bottom corners and middle of the sheet referred to in the previous step).
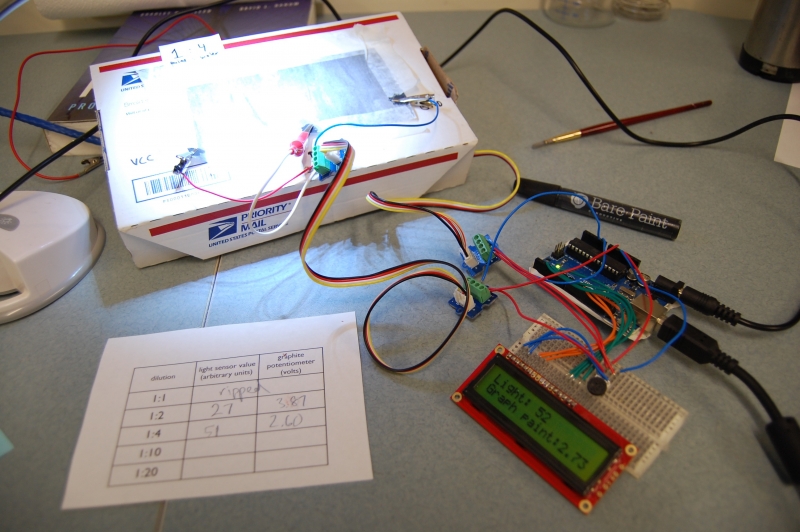
The clips on the sides should correspond to the "GND" and "VCC" wire terminals (two far right screw terminals on the screw terminal). The middle alligator clip should be the "D2" screw terminal.
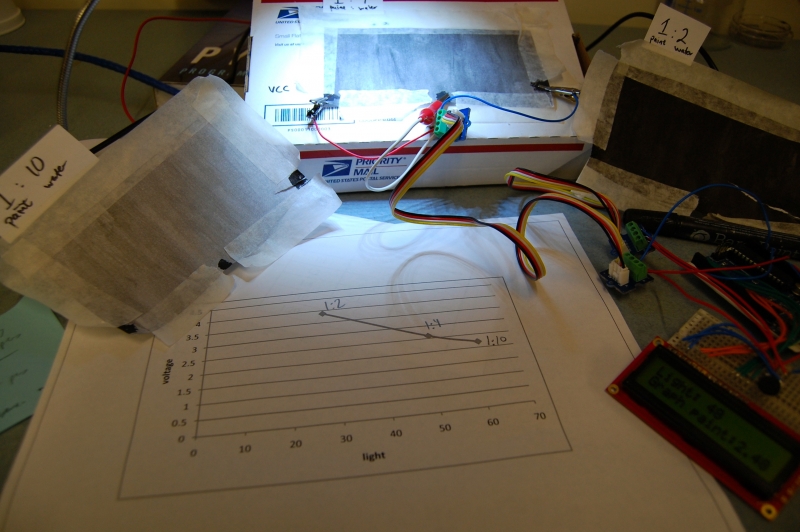
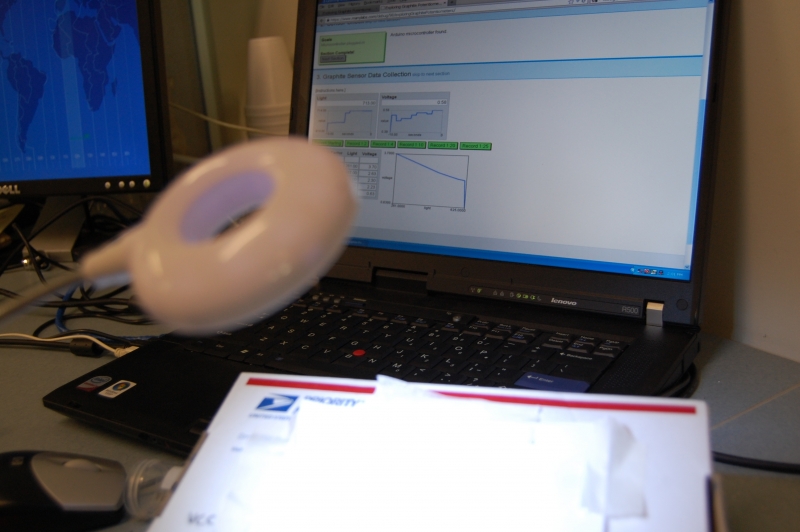
6. For each painted sheet record the light and voltage data by clicking the respective "record" button below the light and voltage plots on the ManyLabs screen. Wait until the values are stable, you can watch this being plotted on your computer screen. As you change the sheets and record new data the data will automatically plot next to the data table. Make sure the light source is the same distance from the sheets after you change the sheets.
QUESTIONS:
Why is the voltage higher for some of the strips of painted paper?
Do you observe a relationship between the voltage and the amount of light that reaches the sensor? why?
If any of the sheets did not conduct electrical current as expected can you think of any reasons why?
VIDEO of the "manylabs" arduino sensor portion of this activity:
Click to view full size:
Standalone Arduino/LCD screen application
We recommend using ManyLabs for this activity but also see pictures below for an optional setup - simply use the arduino, a screw terminal, a photocell and an LCD screen for this activity. For arduino code and other resources email Frank Kinnaman: kinnaman [at] mrl [dot] ucsb [dot] edu.
Click to view full size: